I have handled CompanyOne’s Data Analysis questions multiple times. One thing for sure is that this can be an overwhelming assignment, especially if you have to work and still submit final papers that Exceed Project requirements. Well if you find yourself in this mess, don’t worry. Below is a list of the questions and some screenshots of answers that provide direction as to whether the answers to CompanyOne’s Data Analysis question are correct or not. Follow through, but if you still experience difficulties, we have a team of prolific experts on Google Digital Analytics who can help you provided you make an ORDER REQUEST HERE. Screenshots have been blurred purposely.
Question 1
Company One wants an overview of the website activity of its users. Provide insights on
CompanyOne’s audience for the first quarter in 2021 (1Q2021). Describe insights regarding the
number of users, new users, sessions, number of sessions per user, page views, pages/session,
average session duration, bounce rate, user demographic data (language, country & city),
desktop browsers & operating systems data, and mobile operating systems & screen resolution
data during this timeframe. Provide screenshots to support your analysis.
Sample Answer on CompanyOne’s Data Analysis
Question 2a (Answer provided upon request)
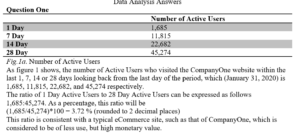
Find the number of active users (1 Day, 7 Day, 14 Day, and 28 Day) during March 2021.
Calculate the ratio of 1 Day Active Users to 28 Day Active Users, expressed as a percentage.
Typically, this ratio is considered a measure of the “stickiness” or retention of users for your
website. It should be 10% or higher for sites where content is refreshed daily, like news sites, or
where the site derives its revenue primarily from advertising. For social sites like Facebook and
WhatsApp, the ratio could be a lot higher (> 50%). For Ecommerce sites like CompanyOne,
where usage is less frequent but of higher monetary value, the ratio is typically lower than 10%.
Also, compare the graphs for 1 Day Active Users to 28 Day Active Users. What conclusions can
you derive? Please provide a screenshot to support your analysis.
Note: Active Users refers to the number of users who visited the CompanyOne website within
the last 1, 7, 14, or 28 days looking back from the last day of the period, which in this case is
March 31, 2021.
The metrics in the report are relative to the last day in the date range. Given that your date
range is March 1, 2021 to March 31, 2021:
1 Day Active Users: the number of unique users who initiated sessions on your site or app on
March 31 (the last day of your date range).
7 Day Active Users: the number of unique users who initiated sessions on your site or app from
March 25 through March 31 (the last 7 days of your date range).
14 Day Active Users: the number of unique users who initiated sessions on your site or app
from March 18 through March 31 (the last 14 days of your date range).
28 Day Active Users: the number of unique users who initiated sessions on your site or app
from March 4 through March 31 (the entire 28 days of your date range)
Question 2b with sample answer for CompanyOne’s Data Analysis
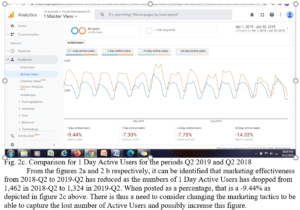
Plot graphs of 1 Day Active Users for the first quarter in 2021 and the first quarter in 2020.
Compare the number of active users for both periods from the two plots. What do you
conclude about the change in marketing effectiveness, if any, from the first quarter in 2020 and
the first quarter of 2021? Please provide a screenshot to support your analysis.
Question 3 CompanyOne’s Data Analysis Answers
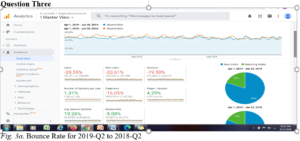
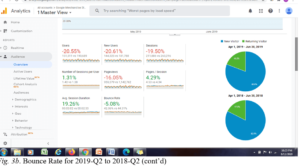
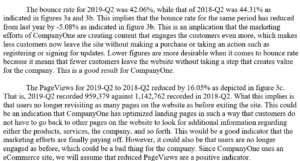
Compare the Bounce Rate for the first quarter in 2021 and the first quarter in 2020. What do
you conclude? Similarly, compare Pageviews for the first quarter in 2021 and the first quarter in
2020. Please provide screenshots to support your analysis.
Question 4 (Answer provided upon request)
CompanyOne wants to focus on younger users (18–24 and 25–34) who shopped during the 2020
holiday shopping season. Has the share of younger users changed from the holiday shopping
season in 2019? Note: November 1 and December 31 are the start and end dates for the
holiday shopping season for CompanyOne. How about changes in the proportions of older
users during the same period? Please provide screenshots to support your answer.
Question 5 (Answer provided upon request)
What about gender? CompanyOne’s objective was to attract a larger proportion of female
visitors to their online store during the 2020 holiday shopping season compared to the same
period in 2019. Was that objective met? Please provide a screenshot to support your answer.
Question 6 (Answer provided upon request)
CompanyOne has invested in a targeted marketing campaign to attract new users to their
online store since the beginning of 2021. Did CompanyOne attract more or fewer new users
from January – March 2021 compared to the same period in 2020, irrespective of gender? What
about new male users? What about new female users? Please provide screenshots to support
your answer.
Question 7
(a) What were the top three countries which sent users to the CompanyOne online store in
2020? In 2019?
(b) When parsing the percentage change in the number of new users by country of
residence, which one of the three countries identified in (a) had the best percentage
change in new users during 2020 compared to 2019? Which one of the same three
countries showed the least improvement? Use the whole year for your comparison.
Please provide a screenshot to support your answer.
(c) What were the top five U.S. states which sent users to the CompanyOne online store in
2020?
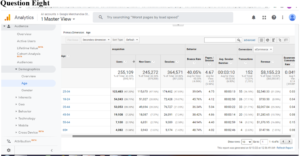
Question 8 (Answer provided upon request)
CompanyOne wishes to target high–value users in future marketing campaigns. These are user
groups with the highest Ecommerce Conversion Rate or Average Order Value. Which age group
generated the highest revenue for CompanyOne in 2020 in dollars? How much was the
revenue from this age group? Which age group generated the least revenue? Which age group
had the highest average order value? Which age group had the highest Ecommerce Conversion
Rate? Based on these observations, which age group or groups should focus on CompanyOne’s
marketing efforts during 2021? In other words, which age group is likely to provide the most
bang for the buck?
CompanyOne desires to examine the performance across the six age groups in further detail.
You will examine the eCommerce data by selecting two dimensions: gender and age. Which
gender and age group combinations had the highest and second–highest revenue in 2020?
Similarly, which gender and age group combinations had the highest and second–highest
average order value in 2020? What would be your recommendation to CompanyOne based on
this analysis? Provide screenshots to support your answers.
Question 8 Answer for CompanyOne’s Data Analysis
Question 9 CompanyOne’s Data Analysis answer on request
CompanyOne wishes to understand its site visitors better to fine–tune its future marketing
efforts. Understanding audience composition in terms of gender, age, and interests will allow
CompanyOne to develop the right creative content and decide the media buys to make.
Google Analytics has over 100 affinity categories such as:
• Shoppers/Value Shoppers
• Lifestyles & Hobbies/Business Professionals
• Sports & Fitness/Health & Fitness Buffs
• Technology/Technophiles
• Banking & Finance/Avid Investors
• Travel/Travel Buffs
• Travel/Business Travelers
• Media & Entertainment/Movie Lovers
• Lifestyles & Hobbies/Art & Theater Aficionados
• Media & Entertainment/Music Lovers
• and many more …
Identify the top three affinity categories for CompanyOne by gender: male and female, for 2020
in terms of the revenue from each affinity category. Please provide screenshots to support your
answer.
Question 10 CompanyOne’s Data Analysis on Request
The two things every online business like CompanyOne cares about: users who convert
(purchase a product) and users who don’t. Understanding users who convert (Converters) will
help CompanyOne refine successful aspects of their marketing and show them where they can
improve their efforts to reach users who demonstrate untapped potential (Non– Converters).
Developing insights into why certain users aren’t converting lets them address the weak spots
in approaching them. For this analysis, CompanyOne wishes to focus on the Back to School
shopping season (July 15, 2020, to September 15, 2020).
CompanyOne wishes to obtain statistics of users, sessions, sessions per user, page views,
average session duration, and bounce rate for these two segments (Converters and Non–
Converters). Comment on these statistics.
Finally, evaluate the differences in user conversion by gender.
Provide screenshots to support your analysis.
